
PlotGenesis™ functions, data, curve-fits, ...
Start MotionGenesis™.
At its line prompt, type Plot.
Click the Function button and enter a function.
Click the View graph button.
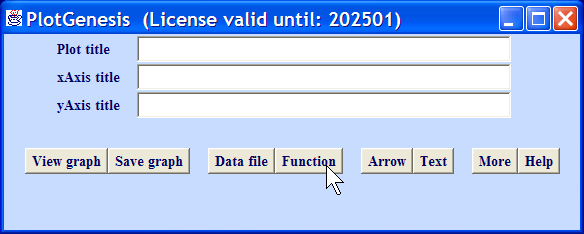

Click the Data File button.
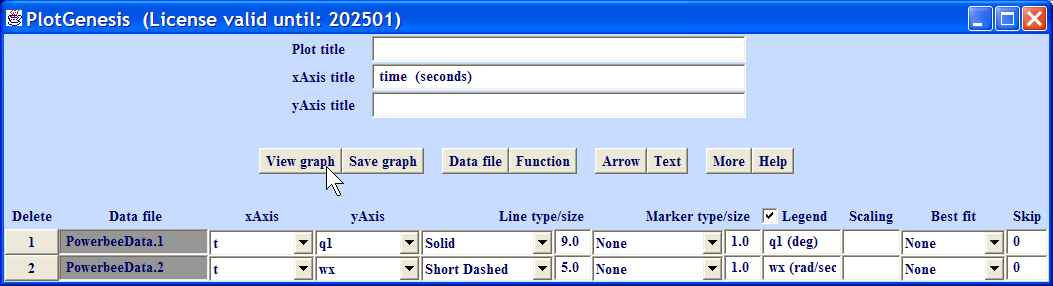
Add curves from data files.
Click the View graph button.

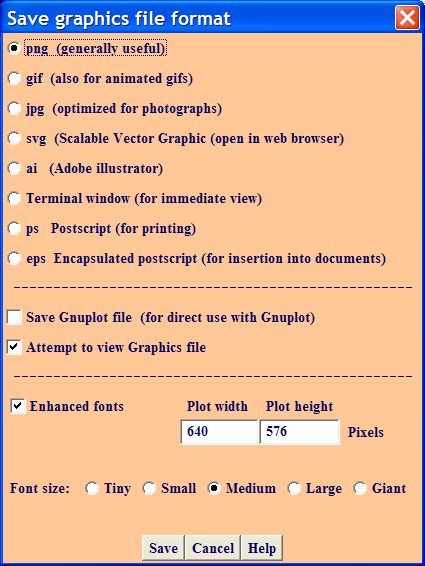
To save the graph in a format such as png, jpg, postscript,
click the Save Graph button.
To view advanced options, click the More button (e.g., for a polar plot).


Another way to start PlotGenesis™ is to
drag and drop a data file onto MotionGenesisStartHere.
Or, from the operating system prompt, type one of the following:
MotionGenesis Plot
MotionGenesis dataFile.1 dataFile.2
MotionGenesis dataFile.1[1, 2, 3] (plots columns 2 and 3 vs. column 1).
MotionGenesis dataFile.1 dataFile.2
MotionGenesis dataFile.1[1, 2, 3] (plots columns 2 and 3 vs. column 1).
Macintosh plotting problem?
Alternatives: MATLAB® (below) or Excel Plotting Tutorial.
MATLAB® alternative: Type the following in MotionGenesis™
to create a MATLAB® script which solves the ODE and creates a MATLAB® plot:
Variable y' = cos(t)
Input y = 0 meters, tFinal = 9 sec
OutputPlot t seconds, y meters
ODE() MGSolveODEAndPlot.m
To run this script, use this MATLAB® help,
except at the MATLAB® prompt >>, type MGSolveODEAndPlot.
